Composed Views
VolumeModel
3D array-like data array is represented by the VolumeModel model class.
Data is logically represented through 3 axis: AXIS_X, AXIS_Y, AXIS_Z. If we inspect the data
through one of the axis, then it can be viewed as a SlicesModel. For that, the VolumeModel class
has the convenience method getSlicesModel() that returns an
SlicesModel instance for the given axis. Additionally, the data for a
specific slice within an axis can be accessed through methods:
getSliceData() and getSliceImageModel().
TODO: Code example.
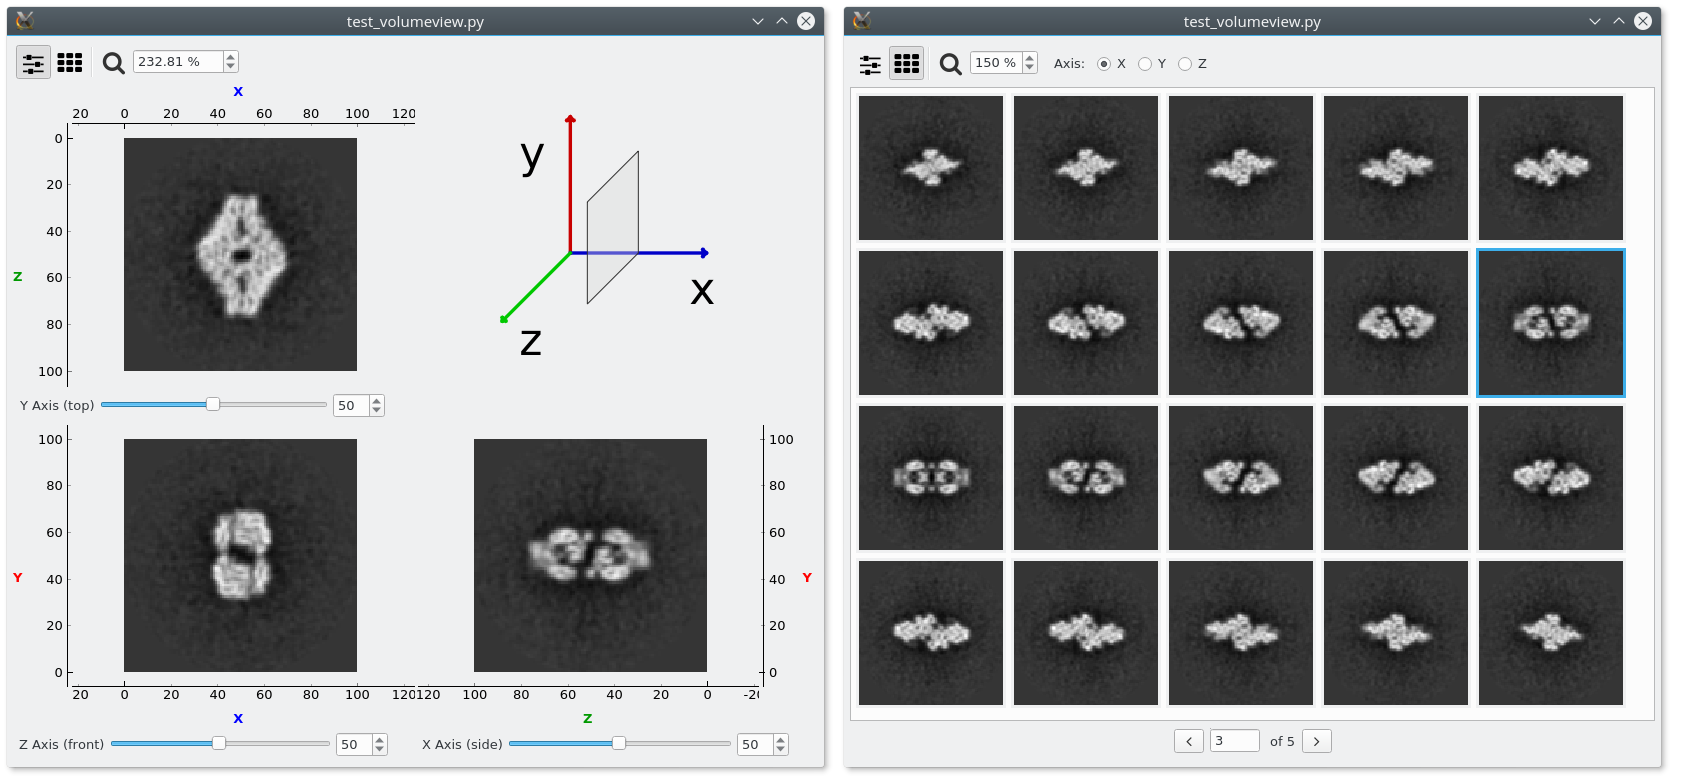
VolumeView
The VolumeView use a VolumeModel as the underlying data model and
it basically makes a composition of two other views: MultiSliceView
and GalleryView. The first one, allows to move around slices for all
the 3 axis at the same time, while in the GalleryView, it is possible to see all slices
of the selected axis. Then, the user can switch between both views.
The following script shows how to implement a simple volume viewer:
1 2 3 4 5 6 7 8 9 10 11 12 13 14 15 16 17 | import sys
import datavis as dv
import emvis as emv
# Read the input filename from first argument
volPath = sys.argv[1]
view = dv.views.GALLERY if '--gallery' in sys.argv else dv.views.SLICES
def createView():
return dv.views.VolumeView(
parent=None,
model=emv.models.ModelsFactory.createVolumeModel(volPath),
toolBar=True,
view=view,
slicesMode=dv.models.AXIS_XYZ)
dv.views.showView(createView)
|
It basically create a new VolumeView from the volume file that is passed as the first
argument. The VolumeModel is created by the function
createVolumeModel() that use internally emcore to read
the volume data. In line 7, we use by default the SLICES view, but if ‘–gallery’ is
provided as argument, we set the GALLERY view.
If we run the script as in the command below, providing an input volume, and with and without the ‘–gallery’ option, we should have a window similar to the one below.
DataView
The DataView class is another composed view. It presents data from
TableModel by composing three other views:
ItemsViewEach row from the table is show at a time. All column values shown in this view as rows and it is possible to render one of them.ColumnsViewMany rows are shown in a given page. It is possible to select which columns are visible and which ones will be renderer (if possible).GalleryViewOne of the renderable columns is used to show rows as an image gallery. Many column values can be displayed as labels under each image.
Configuration settings for each of these views can be passed to
DataView.__init__ in the keyword arguments.