Picker Model and View
PickerModel
The PickerModel class contain the information of Coordinates that
“picked” in Micrographs images. This model maintains a list of micrographs (maybe with
different attributes) and the list of coordinates for each micrograph. This model inherits
from TableModel which is used by the PickerView to display the
table with micrographs information.
Additionally, the getParams() is used by the PickerView
to create dynamically parameters that can be set by the user. These parameters serve
to communicate changes to the PickerModel. Different functions return a
Result object to notify the view about changes
in the data that might imply some updates in the graphical interface.
PickerView
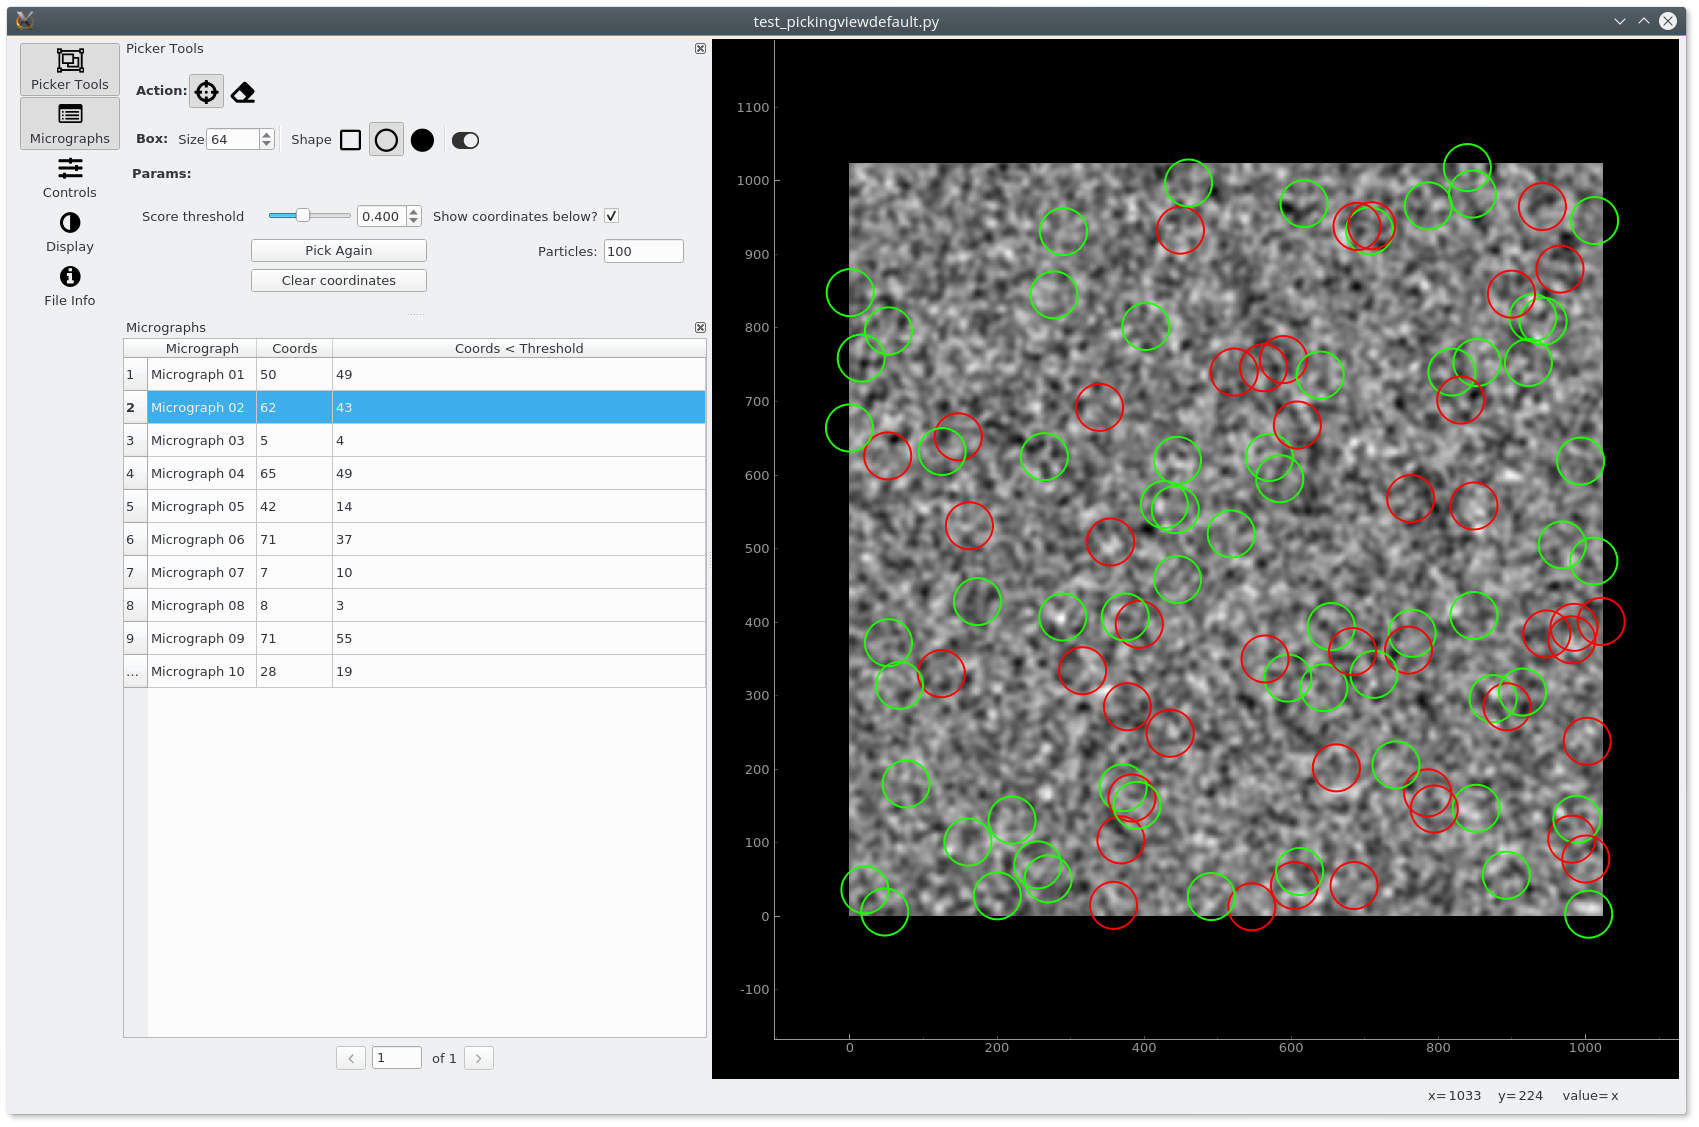
The PickerView is composed by two main panels. The left panels
shows the picking tools and the table of micrographs (fetched from the PickerModel),
among other tools that are available. The right panel displays an ImageView
that display the selected micrograph and the coordinates for this micrographs.
This view can work in Read-Only mode, in which case, the user only inspect existing results, but it is not able to modify the coordinates. In this case, the user still can interact with the provided parameters to analyze existing coordinates (e.g threshold, change picking parameters, etc).
Example
In the following, we will discuss about a simple example of a custom PickerModel
implementation that illustrates very well the flexibility of the PickerView class
and what methods needs be modified from the base PickerModel.
In this example, we will use a test class dv.tests.SimplePickerModel, that just generate random gaussian micrographs and is able to randomly pick coordinates. This is fine for our testing purpose and in a real case can be replaced by the current way to read micrographs data and their coordinates. Here, we will randomly pick coordinates on each micrograph and assign a quality threshold beetween 0 and 1. We want to change the display threshold and show “bad coordinates” (these below the given threshold) in red. We also want to display a custom Micrographs table that shows at a glance the total number of coordinates and which are above and below the threshold.
First, we create a new subclass of PickerModel, but in this case we use as base class the datavis.tests.SimplePickerModel for inheriting the ability to generate random micrographs and coordinates. In the __init__ method, we set some attributes that will be used in other functions and will be updated when necessary.
class MyPickerModel(dv.tests.SimplePickerModel):
    def __init__(self, *args, **kwargs):
        dv.tests.SimplePickerModel.__init__(self, *args, **kwargs)
        self._scoreThreshold = 0.5
        # Modify 'Auto' label to set red color
        self._labels['A'] = self._labels['A']._replace(color='#FF0000')
        self._showBelow = True
We overwrite the getParams() method to specify the
desired parameters:
scoreThresold: allows users to select the threshold that divides the coordinates in “good” or “bad” according to their score. It is a float param, with a given range, so it will be associated to a slider widget.
showBelow: boolean param to select if the “bad” coordinates are shown or not. If shown, they will be rendered in red (using labels explained below)
n: number of random coordinates to select in a micrograph (integer)
clear: action button to remove all coordiantes from the current micrograph
pick: pick n random coordinates in the current micrograph
Finally, the parameters are organized in two rows with two params and the last row only with the clear button.
    def getParams(self):
        Param = dv.models.Param
        scoreThreshold = Param('scoreThreshold', 'float', value=0.5,
                               display='slider', range=(0, 1.0),
                               label='Score threshold',
                               help='Display coordinates with score above '
                                    'this value.')

        showBelow = Param('showBelow', 'bool', value=self._showBelow,
                          label='Show coordinates below?')

        nParam = Param('n', 'int', value=100,
                       label='Particles:',
                       help='Number of particles that you will pick randomly'
                            ' from the current micrograph.')

        clear = Param('clear', 'button', label='Clear coordinates')
        pick = Param('pick', 'button', label='Pick Again')

        return dv.models.Form([
            [scoreThreshold, showBelow],
            [pick, nParam],
            clear
        ])
After defining the parameters, the model needs to implement
changeParam() method that will be invoked
when any of the parameters changed or a button was clicked. The, the
PickerModel can react the the changes and notify back to the view.
In this case, if n or pick are invoked, we randomly pick n coordinates.
If clear, all coordiantes are removed. If scoreThreshold or showBelow
the associated attributes are updated, and it will change the how the coordinates
are labeled and how the view fetch them. Here, the result object by default
has currentCoordsChanged=True and tableModelChanged=True, which means that the
coordinates changed and the table of micrographs also changed.
    def changeParam(self, micId, paramName, paramValue, getValuesFunc):
        # Most cases here will modify the current coordinates
        r = self.Result(currentCoordsChanged=True, tableModelChanged=True)

        if paramName in ['pick', 'n']:
            values = getValuesFunc()
            self.pickRandomly(micId, n=values['n'])
        elif paramName == 'scoreThreshold':
            self._scoreThreshold = getValuesFunc()['scoreThreshold']
        elif paramName == 'clear':
            self.clearMicrograph(micId)
        elif paramName == 'showBelow':
            self._showBelow = getValuesFunc()['showBelow']
        else:
            r = self.Result()  # No modification

        return r
As a subclass of TableModel, the PickerModel should implements the getColumns and getvalue methods. Both methods will be used by the view to reload the micrographs table when tableModelChanged=True is received in a Result objec.
In this example, we show the micrograph id, the total number of coordinates and the coordinates that are below the given threshold. For each column, we need to retrieve the corresponding value in the getValue function.
    def getColumns(self):
        """ Return a Column list that will be used to display micrographs. """
        return [
            ColumnConfig('Micrograph', dataType=TYPE_STRING, editable=False),
            ColumnConfig('Coords', dataType=TYPE_INT, editable=False),
            ColumnConfig('Coords < Threshold', dataType=TYPE_INT,
                         editable=False),
            ColumnConfig('Id', dataType=TYPE_INT, editable=False, visible=False)
        ]

    def __coordsBelow(self, micId):
        return len([c for c in self._getCoordsList(micId)
                    if c.score < self._scoreThreshold])

    def getValue(self, row, col):
        # Re-implement this to show only these above the threshold
        mic = self.getMicrographByIndex(row)
        micId = mic.getId()

        if col == 0:  # Name
            return 'Micrograph %02d' % micId
        elif col == 1:  # Coordinates
            return len(mic) - self.__coordsBelow(micId)
        elif col == 2:  # Coordinates below threshold
            return self.__coordsBelow(micId)
        elif col == 3:  # Id
            return mic.getId()
        else:
            raise Exception("Invalid column value '%s'" % col)
The full example can be found at: https://github.com/3dem/datavis/blob/master/datavis/tests/test_pickingviewdefault.py
When exectuting the example, we should see the following interface: