Basic Image Models and Views
ImageModel
The ImageModel class is the most basic model, that is essentially a
container of 2D array-like data. It can be initialized completely empty, or some 2D data can be passed.
Following code example is take from a test case:
import datavis as dv

# ...
imgModel = dv.models.ImageModel()  # Empty ImageModel

# Data and dimensions should be None
self.assertIsNone(imgModel.getData())
self.assertIsNone(imgModel.getDim())
We could also initializate the model with some data or use the
setData() after creation.
import numpy as np

# ...
data = np.ones((100, 200))
imgModel.setData(data)

# Data should not be None, neither dimensions
self.assertIsNotNone(imgModel.getData())
self.assertEqual(imgModel.getDim(), (200, 100))
self.assertEqual(imgModel.getMinMax(), (1, 1))
The emcore library provides the Image and ImageFile classes to read CryoEM images
from different formats as binary data. In emvis, there are utility classes and function
that use emcore under-the-hood to read the data. For example, one can easily create
an ImageModel for an image on disk:
import emvis as emv

# ...
im = emv.utils.ImageManager()
imgModel = dv.models.ImageModel(data=im.getData(imagePath))
ImageView
The ImageView widget use the ImageModel class to retrieve
the data that will be displayed. The current implementation of the ImageView class is based on the
pyqtgraph.ImageView
class. Throw this widget, our ImageView class supports many display functions such as: zooming, dragging,
axis display and histogram visualization, among others. Many of these options can be set through the
keywords parameters of the ImageView.__init__ method.
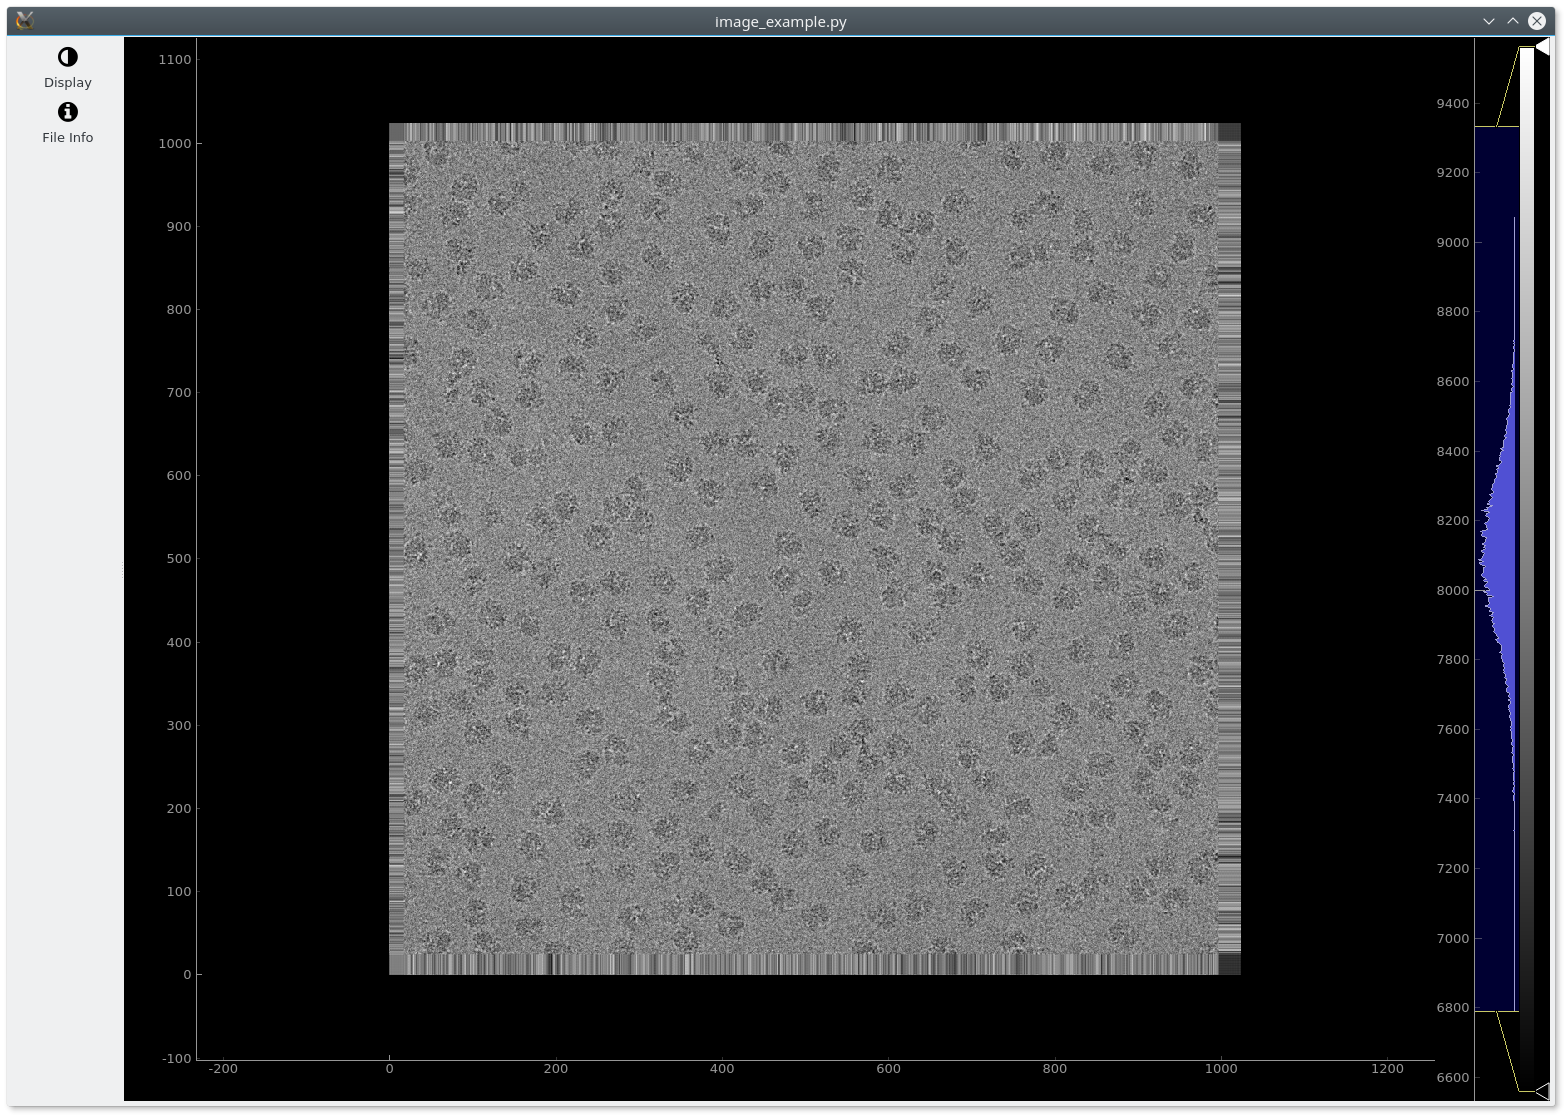
A simple example (image_example.py) that displays a CryoEM image using ImageView is shown below:
1 2 3 4 5 6 7 8 9 10 11 12 13 14 15 16 17 | import sys
import PyQt5.QtWidgets as qtw
import datavis as dv
import emvis as emv
# Read the input filename from first argument
imgPath = sys.argv[1]
app = qtw.QApplication(sys.argv)
win = qtw.QMainWindow()
# Create the image model and view
data = emv.utils.ImageManager().getData(imgPath)
imgModel = dv.models.ImageModel(data=data)
imgView = dv.views.ImageView(model=imgModel, parent=win,
histogram=True) # show histogram of pixel values
win.setCentralWidget(imgView)
win.show()
sys.exit(app.exec_())
|
Then, we can execute the script passing an input image:
python image_example.py relion_tutorial/micrographs/006.mrc
The following image should be shown:
SlicesModel
The SlicesModel can be seen as an N-dimesional
ImageModel. So the main difference respect to it, is that the
getData() method has an index argument to choose which
slice’s data should be returned. Additionally, it provides the
getImageModel() method as a shortcut to create an ImageModel
from a given slice.
The VolumeModel class implements the getSlicesModel method that
returns a SlicesModel for a given axis. Moreover, the EmStackModel() class
inherits from SlicesModel and implement how to read each slice from the stack file. The SlicesModel
provides a nice abstraction about how data is retrieved (i.g from disk, memory, computed, etc) and
it is used in an homogeneous way by the View widgets.
SlicesView
The SlicesView widget is very similar to the ImageView
one, but adds an slider for the user to select the slice that is being displayed.
It is very easy to adapt the example script shown above for using SlicesView, just replacing lines 12 and 13 by the following:
1 2 3 4 5 6 7 8 9 10 |
if len(data.shape) == 2:
	imgModel = dv.models.ImageModel(data=data)
	imgView = dv.views.ImageView(model=imgModel, parent=win,
                                 histogram=True)
elif len(data.shape) == 3:
	imgModel = dv.models.SlicesModel(data=data)
	imgView = dv.views.SlicesView(model=imgModel, parent=win,
                                  histogram=True)
else:
|
In this way, if the read data is 2D, an ImageView will be created, if 3D a SlicesView and raise an exception in any other case. So now the script can be calling using 2D or 3D data as input.
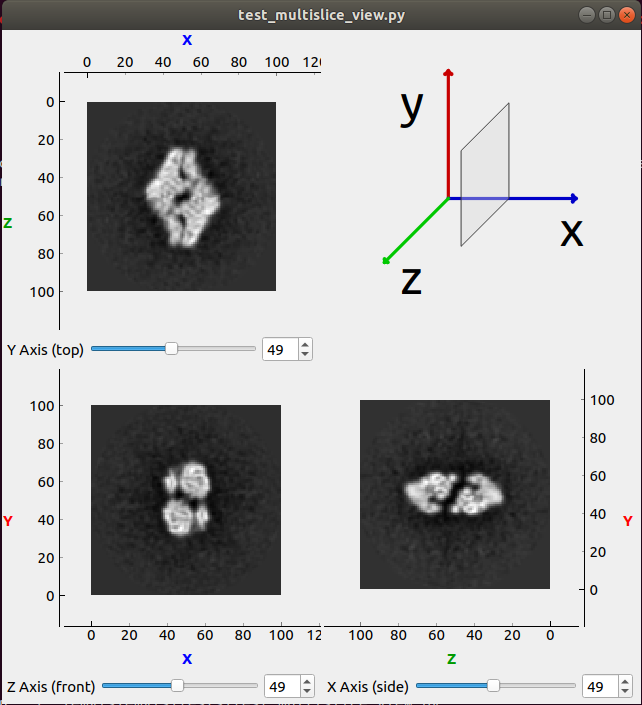
MultiSliceView
The MultiSliceView widget is a composition of 3 SlicesView,
one for each axis x, y and z. This view is a good option to visualize
3D volume data, since it allows to quickly go through the slices of any of the
3 axis. Although, the MultiSliceView is implemented to receive as input 3
independent SlicesView, in practice the input is commonly generated from a
VolumeModel instance, that can provides the required
models for each axis.
The following code snippet shows how to create a MultiSlicesView (all the
PyQt5 application boilerplate code is not shown here). It uses the
ModelsFactory class that creates the VolumeModel from the
provided path.
def createView(self, volumePath):
    volModel = emv.models.ModelsFactory.createVolumeModel(volumePath)
    msv = dv.views.MultiSliceView(
        None, {axis: {'model': volModel.getSlicesModel(axis),
                      'normalize': True}
               for axis in [dv.models.AXIS_X, dv.models.AXIS_Y,
                            dv.models.AXIS_Z]})
    return msv
The MultiSliceView should looks like the image below: